Parkin PD Imaging Progression And Treatment Response
Carryover Notes Above The Imaging Section
l-dopa response is good. (sPD 에서는 Astrocyte 가 neuron 을 inhibit (via GABA), 그러나 parkin-pd 에서는 astrocytosis 가 없어서)

BG maturation (20 y) 이후에 develop.
DBS response is good,
Gut is important (vagus n stimulation)
Longitudinal Progression
(Sun, 2021 #1647) in 30 EOPD patients with homoz or compound heteroz Parkin mutation
(disease duration 9.7 y, H&Y 2-3): 0.203 (SE 0.3162) per year in UPDRS III
(js: this is 0.2842 per year if we convert UPDRS to MDS-UPDRS by multiplying 1.4)
Imaging Notes
[Pyatigorskaya et al 2015].?
- Bruggemann & Christine Klein ([email protected]): (gene review)
- a reduced striatal 18F-DOPA uptake and a reduced presynaptic dopamine transporter density
  [van der Vegt et al 2009]. (putamen is predominantly affected, consistent with the findings
  in Parkinson disease of other etiologies)
- The postsynaptic D2 receptor density as assessed with 11C-raclopride PET is upregulated in
  untreated affected individuals and downregulated in affected individuals who receive
  dopaminergic medication
- Voxel-based morphometry: revealed a decrease of putaminal gray matter volume and a slight
  increase of gray matter in the right pallidum in individuals with PARK-Parkin (i.e., those
  with biallelic PRKN pathogenic variants), whereas asymptomatic individuals heterozygous for
  a PRKN pathogenic variant demonstrated an increase of both putaminal and pallidal gray matter
  volume. Using T2* relaxometry, an increased substantia nigra iron load was detected in four
  symptomatic individuals with PARK-Parkin and two asymptomatic individuals heterozygous for
  a PRKN pathogenic variant
Ribeiro 2009 Cross-Sectional Imaging
(Ribeiro, 2009 #1895) cross sectional: 16 parkin-pd, 19 yopd wo. parkin mutation,
HC three imagings (dopa, datscan, dopamine receptor)

- 18F-Fluoro-L-DOPA: reduced to 67% +/- 21% of control values in caudate and 39% +/- 11%
  of control values in putamen, but no correlation with clinical scores
- 11C-PE2I: significantly reduced (P < 0.0001) to 56% +/- 11% of control values in the
  caudate and to 41% +/- 7% of control values in the putamen and were symmetric in all
  groups of patients, clinical correlation 언급 없으나 아마 없겠지
- 11C-Raclopride: significantly reduced, compared with control values (caudate, 2.72 +/- 0.24,
  P < 0.0002; putamen, 3.02 +/- 0.40, P < 0.02).
TABLE 2. 18F-Fluoro-L-DOPA Ki, 11C-PE2I BP_DAT, and 11C-Raclopride BP_D2 values in different study groups
| Radiotracer | Region | Controls, mean | Nonparkin mean | Nonparkin less affected | Nonparkin more affected | Parkin mean | Parkin less affected | Parkin more affected |
|---|---|---|---|---|---|---|---|---|
| 18F-Fluoro-L-DOPA Ki | Caudate | 0.0123 +/- 0.0012 | 0.0087 +/- 0.0028 | 0.0091 +/- 0.0000 | 0.0083 +/- 0.0025 | 0.0076 +/- 0.0023 | 0.0077 +/- 0.0025 | 0.0075 +/- 0.0024 |
| 18F-Fluoro-L-DOPA Ki | Putamen | 0.0123 +/- 0.0011 | 0.0049 +/- 0.0015 | 0.0051 +/- 0.0018 | 0.0047 +/- 0.0016 | 0.0048 +/- 0.0012 | 0.0046 +/- 0.0013 | 0.0044 +/- 0.0011 |
| 11C-PE2I BP_DAT | Caudate | 4.52 +/- 0.48 | 2.66 +/- 0.69 | 2.75 +/- 0.67 | 2.57 +/- 0.73 | 2.39 +/- 0.22 | 2.41 +/- 0.25 | 2.38 +/- 0.22 |
| 11C-PE2I BP_DAT | Putamen | 4.42 +/- 0.43 | 1.85 +/- 0.42 | 1.90 +/- 0.47 | 1.76 +/- 0.38 | 1.78 +/- 0.14 | 1.77 +/- 0.14 | 1.79 +/- 0.14 |
| 11C-Raclopride BP_D2 | Caudate | 2.72 +/- 0.24 | 2.02 +/- 0.30 | 2.06 +/- 0.29 | 1.98 +/- 0.33 | 1.87 +/- 0.19 | 1.91 +/- 0.17 | 1.83 +/- 0.17 |
| 11C-Raclopride BP_D2 | Putamen | 3.02 +/- 0.40 | 2.63 +/- 0.47 | 2.60 +/- 0.47 | 2.65 +/- 0.48 | 2.33 +/- 0.14 | 2.35 +/- 0.13 | 2.32 +/- 0.20 |
Footnote:
All values are mean +/- SD. Less- and more-affected sides were determined on clinical basis.
Only 33 Parkinson patients were included in final analysis. No significant differences were
observed for Ki, BP_DAT, and BP_D2 between nonparkin and parkin patients. For 18F-fluoro-L-DOPA,
37 controls, 18 nonparkin patients, and 14 parkin patients were studied; for 11C-PE2I (BP_DAT),
11 controls, 9 nonparkin patients, and 7 parkin patients were studied; and for 11C-raclopride
(BP_D2), 8 controls, 8 nonparkin patients, and 5 parkin patients were studied.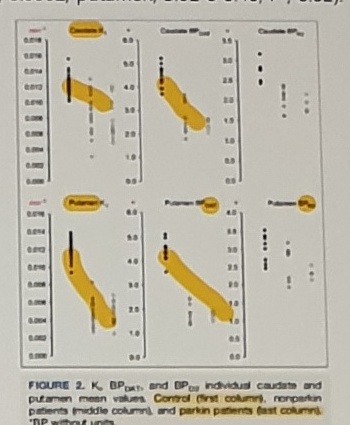
Figure caption:
FIGURE 2. Ki, BP_DAT, and BP_D2 individual caudate and putamen mean values.
Control (first column), nonparkin patients (middle column), and parkin patients (last column).
BP without units.
DATSCAN And 18F-DOPA Longitudinal Notes
DATSCAN: {Isaacs, 2017 #1058} two siblings: down DATscan uptake in putamen,
{Booth, 2015 #1745} 2nd, symmetric and somewhat uniform striatal loss of DaT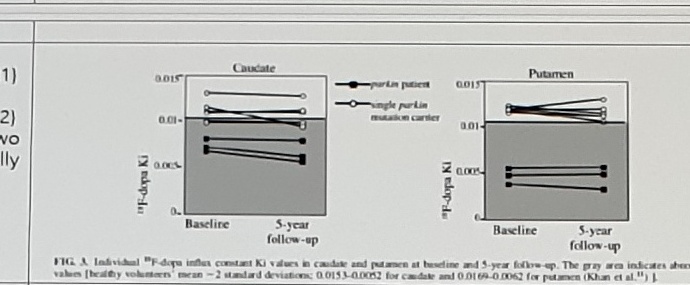
Side/source labels:
(Pavese, 2009 #2081)
(Pavese, 2009 #2082)
These two are actually identical.
(Khan, 2002 #2083)
longitudinal
Text next to the figure:
In the group of patients with parkin-linked parkinsonism, we found that the loss of nigrostriatal
function, as measured by annual reduction 18F-dopa uptake, occurs at a very slow rate (0.5%
annual reduction in putamen 18F-dopa uptake and a mean 2% annual reduction in caudate 18F-dopa
uptake over 5 years). Reduction of midbrain 18F-dopa uptake in our patients with parkin also
seems to occur at a slow rate (0.59% per annum).

The mean percentage rate of decline of putamen [18F]dopa uptake relative to the normal mean was
1.47% (+/- 0.5) per annum for the parkin group and 5.71% (+/- 1.63) per annum for the IPD group.
Norbert Brueggemann presented this.
Pellecchia 2007 FP-CIT SPECT
TABLE 1. Baseline and follow-up [123I]FP-CIT SPECT outcome measures in the parkin kindred
| Group | Individual | Baseline caudate V3 | Baseline putamen V3 | Baseline putamen-to-caudate ratio | Follow-up caudate V3 | Follow-up putamen V3 | Follow-up putamen-to-caudate ratio | Phenotype |
|---|---|---|---|---|---|---|---|---|
| Homozygous parkin carriers | II-4, F (64 yr) | 1.08 | 0.72 | 0.67 | 1.45 | 0.64 | 0.44 | ET + Park |
| Homozygous parkin carriers | III-1, M (36 yr) | 1.38 | 0.69 | 0.50 | 1.54 | 0.72 | 0.47 | ET + Park |
| Homozygous parkin carriers | III-3, F (29 yr) | 2.02 | 0.92 | 0.46 | 1.75 | 0.85 | 0.48 | ET |
| Homozygous parkin carriers | II-8, M (58 yr) | 2.02 | 1.22 | 0.60 | NP | NP | NP | normal |
| Heterozygous parkin carriers | II-3, M (64 yr) | 2.30 | 1.83 | 0.80 | 2.41 | 1.95 | 0.81 | ET |
| Heterozygous parkin carriers | II-7, M (62 yr) | 2.46 | 1.94 | 0.79 | NP | NP | NP | ET |
| Mean +/- SD | - | 1.85 +/- 0.60 | 1.22 +/- 0.61 | 0.64 +/- 0.16 | 1.79 +/- 0.43 | 1.04 +/- 0.61 | 0.55 +/- 0.17 | - |
| Controls (mean +/- SD) | - | 3.00 +/- 0.23 | 2.61 +/- 0.29 | 0.87 +/- 0.04 | - | - | - | - |
Interpretation text:
longitudinal DATscan in 2 parkin-pd. The 2 homozygotes with ET and Parkinsonism showed a 59%
decrease of caudate V3 and a 73% decrease of putamen V3. Striatal dopamine transporter (DAT)
density was more reduced in homozygous (33% in the caudate, 61% in the putamen) than in
heterozygous (21% in the caudate, 28% in the putamen) mutation carriers (Fig. 2).

- Follow-up SPECT study at 2.3 +/- 0.5 years in 3 homozygous and 1 heterozygous members of the
  family did not show significant change of whole striatal DAT density as compared to baseline
  (2.3% +/- 4.7%/y, P = 0.6 by paired t test, Table 1).
DTI
[DTI]
{Koinuma, 2021 #1899} Although the WM volumes were not significantly different, the TBSS analysis
revealed a corresponding decrease in fractional anisotropy and an increase in mean diffusivity
and radial diffusivity in WM areas, such as the anterior and superior corona radiata and uncinate
fasciculus, in PRKN patients compared with controls. Furthermore, 9-hydroxystearate, an oxidative
stress marker, and disease duration were positively correlated with several parameters in PRKN
patients. Conclusion: This pilot study suggests that WM microstructural impairments occur in PRKN
patients and are associated with disease duration and oxidative stress.
Neuromelanin MRI
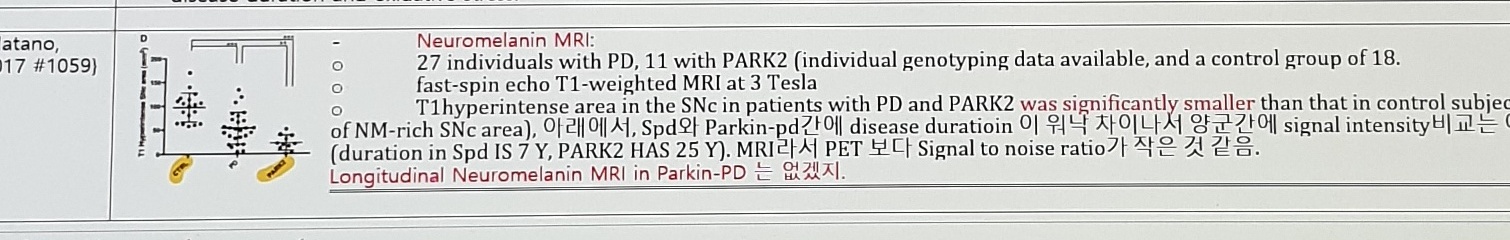
(Hatano, 2017 #1059)

Neuromelanin MRI:
27 individuals with PD, 11 with PARK2 (individual genotyping data available), and a control group
of 18.
fast-spin echo T1-weighted MRI at 3 Tesla
T1hyperintense area in the SNc in patients with PD and PARK2 was significantly smaller than that
in control subjects. (ie, down size of NM-rich SNc area), 아래에서, sPD와 Parkin-pd간에 disease
duratioin 이 워낙 차이나서 양군간에 signal intensity비교는 어려움
(duration in sPD is 7 y, PARK2 has 25 y). MRI라서 PET 보다 Signal to noise ratio가 작은 것 같음.
Longitudinal Neuromelanin MRI in Parkin-PD 는 없겠지.
MDSGene Reported Signs And Symptoms
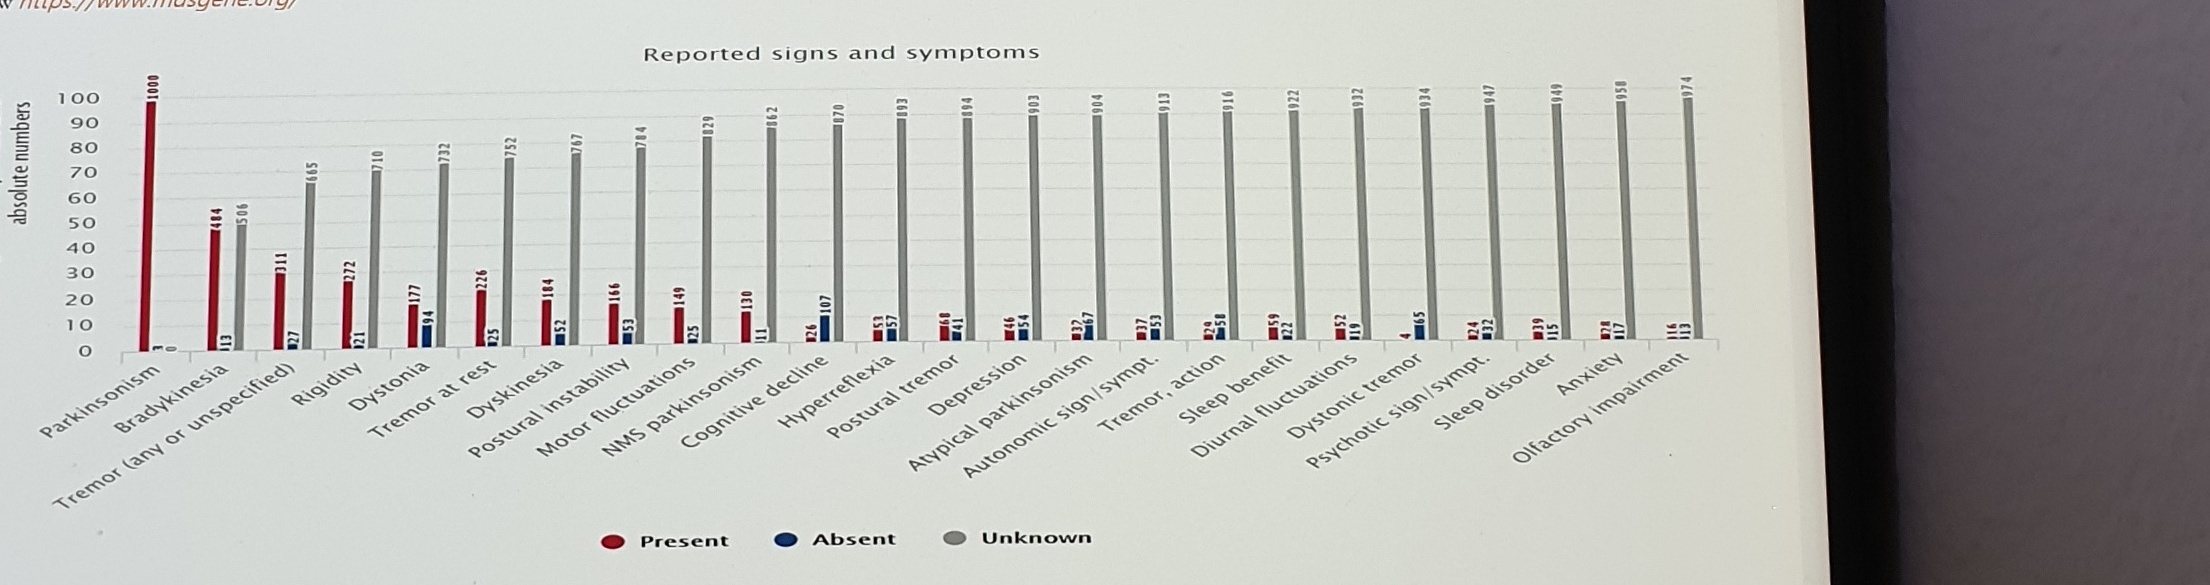
Source:
www https://www.mdsgene.org/
Reported signs and symptoms
Legend: Present / Absent / Unknown
X-axis labels include:
Parkinsonism
Bradykinesia
Tremor (any or unspecified)
Rigidity
Dystonia
Tremor at rest
Dyskinesia
Postural instability
Motor fluctuations
NMS parkinsonism
Cognitive decline
Hyperreflexia
Postural tremor
Depression
Atypical parkinsonism
Autonomic sign/sympt.
Tremor, action
Sleep benefit
Diurnal fluctuations
Dystonic tremor
Psychotic sign/sympt.
Sleep disorder
Anxiety
Olfactory impairment
Treatment In Parkin PD
Tx in Parkin PD

(Wasner, 2020 #1696) The overwhelming majority of Parkin mutation carriers respond favorably to
Levodopa treatment (>98%). Of those with reported information, 93% respond well to Levodopa and
only a small minority shows a moderate (4%) or minimal (3%) response, respectively
(www.mdsgene.org). https://www.mdsgene.org/d/1/g/4

l-dopa response is good. (sPD에서는 Astrocyte 가 neuron을 inhibit (via GABA), 그러나 parkin-pd 에서는
astrocytosis 가 없어서)

(Wasner, 2020 #1696) Although prospective studies are still lacking, it appears that DBS is as
effective in Parkin mutation carriers as in idiopathic PD patients (de Oliveira et al., 2019;
Kim et al., 2014; Rizzone et al., 2019).

EPOP (BUT source?) Parkin PD patient is unresponsive to deep brain stimulation treatment
DBS response is good
Parkin/PINK1 Mitophagy Diagram

This diagram is only partially visible at the bottom of the photo. Labels include:
normal
PINK1
Ub phosphorylation by PINK1
pUb binding with Parkin & PARKIN recruitment to mitoch...
Parkin phosphorylation by PINK1
Parkin activation
Parkin's ubiquitination of mitochondria surface proteins
Mito fission (to isolate damaged mito from ...)
mitophagy
Uncertain Spans
- Ribeiro 2009 PET/SPECT table values are small; the embedded figure/table image should remain the primary evidence for numeric extraction.
- Pellecchia 2007 FP-CIT table row IDs, ages, V3 values,
NP, phenotypes, and the2.3 +/- 4.7%/y, P = 0.6line are small text. - The
EPOP (BUT source?)DBS sentence conflicts with the surrounding “DBS response is good” note and should be reviewed. - The Parkin/PINK1 mitophagy diagram is only partially visible; bottom rows and downstream labels continue beyond this photo.